Thursday, November 19, 2015

Investigation 5: Photosynthesis

Introduction
How does the oxygen that we breathe enter the air? And how does the carbon dioxide that we exhale get taken out of the air so that we do not suffocate on it? The answer to both of these questions is photosynthesis, a chemical process for creating energy and sugars within a plant. Photosynthesis takes place in the leaves of a plant, and within the leaves' cells, in the chloroplast. In the chloroplast are specialized molecules called chlorophyll that absorb light and this absorption excites an electron that then goes through a complex series of reactions to form NADPH, an electron carrier, and ATP, an energy source for the cell.

An Overview of Photosynthesis


However, the chlorophyll only absorb a certain frequency of light, and it only absorbs light from the visible light spectrum, so colored light. The chlorophyll do not even absorb the entire spectrum of visible light, usually only absorbing one or two colors of light between a certain wavelength very well, and reflecting the rest. The plant has developed two different types of chlorophyll to account for that, chlorophyll a and chlorophyll b, as well  separate compound called carotenoids.

Absorption Rates of Chlorophyll and Carotenoids


On Friday, November 6th, Vikram, Vinay, Shreyan and I entered the lab again to learn more about photosynthesis. We decided to test the rate of the reactions of photosynthesis under different colored light so that we could see to what affect the absorption of light by the chlorophyll and carotenoids affected the overall reaction. We hypothesized that the rate of reaction would slow when under green light because the chlorophyll and the carotenoids have very low absorption rates in green light as seen above. Also, leaves reflect green light, as seen in their green color.

Our first problem is finding a method by which we could measure the rate of photosynthesis in a plant. Because it is a minuscule process, we couldn't observe it directly through a microscope, but instead would have to find evidence that it is occurring. Here is the chemical equation for photosynthesis:


To find the rate of photosynthesis, we could track the production of one of the products above, or the diminishing of one of the products. Carbon dioxide is a possibility, but would be difficult to measure in an open environment. Water is likewise hard to track, as well as glucose, because we cannot directly see the number of molecules. This leaves us with oxygen, which is also difficult to track individual molecules. Instead of doing that, however, we decided to use the buoyant properties of oxygen in water to measure the rate of reaction. Because as oxygen is produced in leaves during photosynthesis it is kept in the center of the leaf before being expelled through the stomata, the leave actually becomes quite airy. So we could put the leaves in water and watch them float to the top. But to photosynthesize, there must be a source of light, a source of H2O and a source of CO2. If the leaves were submerged, they would not have access to CO2 and would therefore not photosynthesize. Therefore we submerged the leaves in a bicarbonate solution, which would put CO2 into the water for the plant to grab and use for photosynthesis.

The problem with this plan was that the leaves already contained oxygen, so they would float on their own. The only way around this was to evacuate the oxygen from the leave by sucking it out using pressure. At a lower pressure, the oxygen will expand and fill the space, leaving the leaf for the most part and entering the surrounding space around the leaf. Doing this evacuation on a leaf would require larger syringes and tools than we have available so instead we decided to cut the leaves into small dots so they'd fit in the syringe and it would even make the submersion in water easier because then we would not have to find a large tank to submerge full leaves in.

As you can see, a leaf consists of cells but also quite a bit of empty space to hold gases like CO2 and O2


For our experimental variable, which is the color of the light that the plant would be exposed to, we figured we could change this using different colored cellophane. The cellophane would absorb all of the light that wasn't its own color, and let that color through to hit the leaf-dots below. For our controls we performed an experiment with clear cellophane that would supposedly let all light through, but we also did an experiment without cellophane to see if the clear stuff did in fact absorb even a tiny amount of light.

Because of the time consuming nature of the reaction and its effects on the leaf-dots, and the limitations of our equipment, the lab group joined forces with a lab group consisting of Christos, Jorgos and Callen. One group would do three cups with different variables, and the other would do three different cups with different variables, and the data would be shared among us all. Vikram, Vinay, Shreyan and I did the experiments with blue cellophane, yellow cellophane and no cellophane at all.

With this plan of attack, we began our experiment.

Procedure
First, the lab group went outside to pick two fresh ivy leaves to perform our experiment with. We needed to get still living leaves so that they would perform photosynthesis. Next, using the apparatus shown below, I hole-punched 30 dots of leaf out of the leaves and split them into 3 piles. These would be later used for our experiment.


Next, the group created 300mL of a 0.2% bicarbonate solution to submerge the leaves in. Then we evenly separated the solution into three cups and cut three pieces of cellophane for the cups; one blue, one yellow and one clear. Then a drop of dilute soap was added to each cup. The soap acts as a wetting agent to force the leaf dots to allow water from the solution into the cell and sink. This also helps the leaves get their source of CO2 from the solution.


Next we evacuated the leaf dots of all air. To do this, we put 10 dots at a time into a syringe with a stopper and sucked up 10 mL of the bicarbonate solution into the syringe. Then we upended the syringe and squeezed the stopper so all of the air in the solution was evacuated. Once this was done, I put my finger on the opening of the syringe and pulled back on the stopper, effectively creating a vacuum in the syringe chamber, for 10 seconds. I then released the stopper and poured out the 10 leaf dots into one of the cups. This was repeated for each separate group of leaf dots.

Once the first set of leaf dots was evacuated, we immediately started our experiment so as to avoid sunlight causing the leaves to begin their photosynthesis while we evacuated the rest of the dots. This would've caused a skew in our data, but luckily we removed that confounding variable. The experiment consisted of a piece of colored (or clear) cellophane covering the cup and the cup was then placed under a lamp. The light from the lamp then caused the cells in the leaf dots to photosynthesize. We also started a separate timer for each experiment group so we could accurately keep time.

After all of the dots were in their cups and the cups were placed under the lamp, we observed the number of leaf dots that had risen completely to the top and recorded this data. After all the dots had risen, or 30 minutes, the experiment was stopped, and the dots were poured out.

Data/Tables
Here are the results of trials with the blue, yellow and lack of cellophane.

Time (min)
# of dots risen (clear)
# of dots risen (blue)
# of dots risen (yellow)
1
0
0
0
2
0
0
0
3
0
0
0
4
0
0
0
5
0
0
0
6
0
0
0
7
0
0
0
8
0
0
0
9
0
0
0
10
0
0
0
11
0
0
0
12
0
0
0
13
0
0
0
14
0
0
1
15
0
0
2
16
0
0
4
17
0
0
5
18
2
0
5
19
3
0
7
20
6
0
7
21
8
0
7
22
10
0
7
23
-
0
8
24
-
0
8
25
-
0
9
26
-
1
9
27
-
1
9
28
-
1
10
29
-
2
-
30
-
3
-


And a picture of the experiment in action:


Here is the data received from our lab group partners Jorgos, Christos and Callen, who experimented with green cellophane and a control cup of no cellophane.

Time (min)
# of dots risen (no cellophane)
# of dots risen (green)
1
0
0
2
0
0
3
0
0
4
0
0
5
0
0
6
0
0
7
0
0
8
0
0
9
0
0
10
0
0
11
0
0
12
0
0
13
0
0
14
0
0
15
0
0
16
0
0
17
1
0
18
1
0
19
1
0
20
1
0
21
1
0
22
1
0
23
1
0
24
1
0
25
1
0
26
1
0
27
2
0
28
2
0
29
2
0
30
2
0


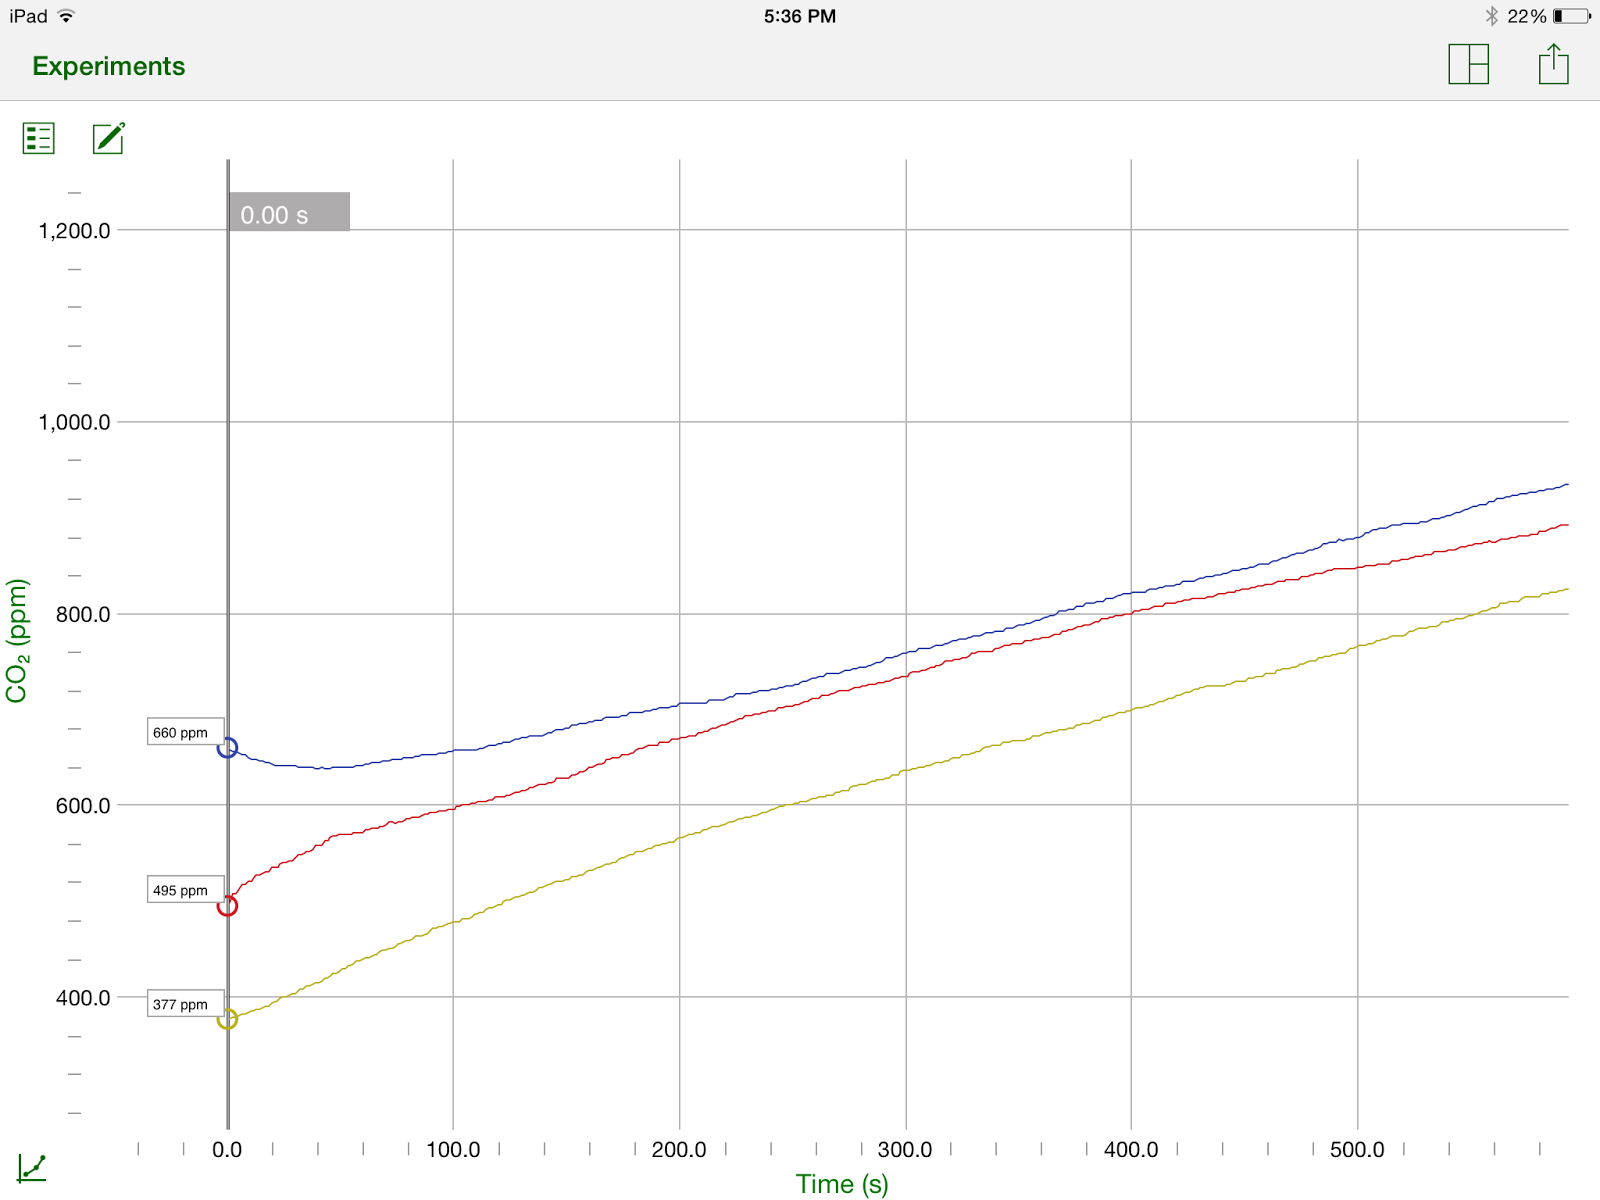
Here is a graph of the results of both experiments combined:


Conclusion
Looking at the results of our experiment, I'd say that the lab was a relative success. As expected, when the plant was exposed to all types of light while under the clear cellophane, the rate of photosynthesis was fastest because all 10 dots floated to the top in the shortest amount of time when compared to single-color lights. However, a confusing piece of data is the extremely low number of dots, only 2, that floated to the top without any cellophane in Christos, Jorgos and Callen's experiment. Plants do not need cellophane to photosynthesize because cellophane is not found in nature, so that cannot be the reason why the dots didn't rise. I believe that there could have been some error with the evacuation of the cells because if one evacuates the cell too hard or for too long, the cell's chloroplasts will die and it will not photosynthesize. This could have happened for our compatriots. Other points of data, however, are quite normal. We did not expect the dots to photosynthesize much while under green light because leaves do not absorb much green light, if any. I was somewhat surprised at our data for blue light because I had thought that the rate of absorption hit a peak for chlorophyll when under blue light, but only 3 dots rose to the top of the water in that group. The results of the yellow group are also predictable because some of the peak absorption of leaves happens near red light, which is right next to yellow light on the visual light spectrum. Therefore, plants should also be able to absorb a lot of yellow light.

Due to the evacuation error mentioned above, as well as other fixes for the lab, the experiment could be improved in a variety of ways. First of all, all of the leaf dots should be evacuated together so that they all have the same level of evacuation when starting the experiment. This would also make sure that different groups using different syringes and applying different pressures wouldn't skew the data as it did for Jorgos' group. Another way in which the lab could be improved is, if the lab group had a long time to spend doing the experiment, we could use the same lamp and place the cup in the same spot each time so that we can ensure that the dots in the cup are receiving the same amount of light from the lamp and that they aren't missing out on light due to position.

I believe that this can be considered a success because we got data that we expected to get, our hypothesis was proved true, but also because we made mistakes. These mistakes helped us to learn ways in which we could improve our lab for next time as well as how to look out for confounding variables in coming labs we have not performed yet.

Thursday, October 29, 2015

Investigation 6: Cellular Respiration

Introduction
Today we are going to talk about cellular respiration, a vital process that cells perform every second. Constantly, cells are breaking and forming bonds, moving molecules around, expending energy and using up substances. Why are these cells working hard all the time? Well organisms need energy to perform vital functions such as moving, reproducing and growing, and the only way to get this energy from its surroundings is to perform cellular respiration. Cellular respiration works by breaking apart a sugar and then capturing energy released from breaking those bonds onto molecules called ATP, but for now we will focus on the process of cellular respiration, not the entire process of energy transfer.Today we are going to talk about cellular respiration, a vital process that cells perform every second. Constantly, cells are breaking and forming bonds, moving molecules around, expending energy and using up substances. Why are these cells working hard all the time? Well organisms need energy to perform vital functions such as moving, reproducing and growing, and the only way to get this energy from its surroundings is to perform cellular respiration. Cellular respiration works by breaking apart a sugar and then capturing energy released from breaking those bonds onto molecules called ATP, but for now we will focus on the process of cellular respiration, not the entire process of energy transfer.

This is the chemical equation for cellular respiration


On October 22nd, Vinay, Shreyan, Vikram, and I returned to the lab to perform an experiment to measure cellular respiration and determine the effects of sound on the respiration of a meal worm. The first problem that we encountered was how to measure the cellular respiration, a tiny chemical process, in a meal worm? The group could have measured any of the compounds formed by the chemical equation above, such as the decreasing amounts of glucose in the worm or increasing amounts of water in the worm, but these would be very difficult to measure, especially if we didn't want to kill the worms. The group instead chose to measure the increasing amounts of carbon dioxide in the air as this would show that cellular respiration was occurring. Also, the carbon dioxide sensors that Mr. Wong gave us only worked for that specific compound. 

A meal worm

After figuring out how to measure the rate of cellular respiration, the group decided how to use sound to affect a meal worm's rate of respiration. Our first thought was to use different types of music, such as a song with a slower beat versus one with a fast beat, soft sound versus loud, or a song with less bass or more bass. After some discussion, we decided to not use music because there are so many different types of sound that we wouldn't be able to track what specific difference between two songs cause a change in the worm's respiration. Instead, we decided to use extremely high and extremely low frequency sounds on the meal worms. We accomplished this by downloading a dog whistle application that had a frequency toggle on the sound it produced so that we could directly affect what our meal worms were listening to. Our hypothesis for this experiment was that the higher frequency sounds would increase the worms' rate of reaction because the energy of the sound would frenzy and eventually kill the worms. 

The purpose of this lab was to design and perform our own experiment using organisms and manipulating specific factors of their environment to increase or decrease the rate of cellular respiration in the worms. The purpose is also to apply knowledge learned in class to a practical situation and see if our knowledge of cellular respiration could expand through creating our own experimentation procedures.

Procedure
First, the lab group grabbed a beaker, a Vernier carbon dioxide sensor and rubber stopper for the top. Then we put two large meal worms into the beaker and brought all of our components to our lab station. I then connected the sensor to my iPad so it would record the data of the increasing levels of carbon dioxide and graph it on my tablet. After this, we stoppered the beaker, with the sensor attached, sealing off the worms from outside air and allowing the sensor to measure the respiration. We then set the timer for ten minutes and watched our worms move around. After the ten minutes were up we unstoppered the beaker, saved our data and put the worms back into the tub of worms. We did this so that our data would not be contaminated by worms full of cells that were oxygen deprived. We wanted fresh worms for every trial.

For our second trial, we followed the same procedure as before for gathering the worms and setting up the beaker, but then played a very high frequency dog whistle sound from the iPad into the side of the beaker at the worms. We continued this for ten minutes and then stopped the sound, recycled our worms, and saved the data. The third trial was the exact same as the second, but instead of a high frequency sound, we played a low frequency sound to the worms. 

Data/Results
Here is the graph of our data.
The Blue Line is our control experiment, the Yellow Line is our high frequency experiment, and the Red Line is our low frequency experiment


Here is a table containing all the values of carbon dioxide in the beaker every minute, and the total change in amount of carbon dioxide in the beaker. (The units are parts per million or ppm)

Trial/Time
Trial 1 (control) (ppm)
Trial 2 (High Frequency) (ppm)
Trial 3 (Low Frequency) (ppm)
0 min
660
377
495
1 min
643
441
574
2 min
666
501
610
3 min
696
549
655
4 min
720
592
697
5 min
758
636
735
6 min
795
674
775
7 min
833
716
814
8 min
867
751
840
9 min
902
792
866
10 min
938
831
895
Total Change (ppm)
+278
+454
+400

Here are pictures of the sensor-beaker system we set up.


Conclusion
The results of the experiment were much as the lab group had predicted. We hypothesized that the worms would respire more with a high frequency sound than with a low frequency sound or the control group, which did occur. With the high frequency sound, the worms added 454ppm carbon dioxide to the air, while with low frequency they only added 400ppm and a measly 278ppm by the control group. We did not observe the worms becoming frenzied as we had though they would in the high frequency trial, and we also discovered that the worms were alive after this trial. The lab group believed that the worms would be killed by the sound, or at least use up all of their oxygen faster because of it. We may have still been right and it just takes longer for the worms to die. One oddity that we came across in our data is the relatively high rate of cellular respiration by the worms at the beginning of trials 2 and 3. For trial 2, in the first 2 minutes alone, the amount of CO2 in the air increased by about 130ppm, almost a third of the overall increase of carbon dioxide. For the third trial, the rate was somewhat less drastic, increasing by 120ppm, but still was about one third of the total change in concentration of carbon dioxide.

I believe that the experiment was quite successful in hindsight. We saw the effects of respiration on the carbon dioxide content of the beaker, and we also observed that sound has an effect on the respiration of meal worms. In both of the sound trials, the respiration of the worms greatly increased in comparison to the silent first trial. We are not sure why this occurred, but it could be for a variety of reasons. First of all, the change could have been due to the experiment's change in location for the second and third trials. So that we would not bother or disturb other lab groups and their experiments with our sound, the lab group had to move outside. Perhaps the increase in respiration was due to the sunlight, temperature, or different colored surroundings that the worms were placed in. This could be fixed by confining the worms to a certain color background and temperature exposed to steady artificial lighting to control those variables. Second of all, the increase in carbon dioxide in the beaker could be because we used different worms for each trial, but the same beaker, so there was already an abnormal amount of carbon dioxide in the beaker. When the sensor was placed in the beaker, it would have taken it a little bit to totally adjust to the true amount of CO2 in the beaker, which explains the supposedly high rate of respiration in the opening minutes of both Trial 2 and 3. This could be easily fixed by having three concurrent trials in three different beakers that had been previously exposed to similar atmospheric environments. Thirdly, the worms might have actually had a higher rate of respiration during the trials with sound because meal worms seek dark and quiet habitats in nature, such as under rocks and in caves, so the sound could be instinctively programmed into their tiny brains as dangerous. More sound would mean less isolation and therefore more vulnerability for the worm. Also, the higher pitch sound's increased effect on respiration could have been because meal worms are primarily eaten by birds, many of whom have distinctively high pitched calls. As a result, when exposed to higher pitched sounds, the worms heart rate increases and they panic to try and escape the perceived danger. I think an interesting follow up experiment would be one using specific bird calls of birds that eat meal worms. In addition, perhaps exposing the worms to pheromones from these birds, thus supplementing the illusion of an impending attack, to examine the effects of more panic on cellular respiration on meal worms. 

Thursday, October 1, 2015

Investigation 4.2 on Osmosis

Introduction
Membranes are one of the miracles of life. Present in all life forms, membranes regulate the flow of materials in and out of the cell and make sure that the every cell, from the smallest bacterium to the largest multicellular organism like humans, receive exactly what it needs and exactly how much. In most cells, there is a lipid bilayer that has both hydrophilic and hydrophobic regions to regulate the flow of water in and out of a cell. The transfer of water across a membrane is called osmosis, and the lab group and I carried out another experiment to model this.

A Cell's Phoso


On September 25th, Vinay, Shreyan, Vikram and I did an experiment to determine the effects of different solutions on osmosis out of a cell through measuring the rates of weight change in the tubes using dialysis tubes and solutions of different solutes. A dialysis tube is a selectively permeable membrane that will allow water and certain other solutes to flow through. The direction of the flow of the water is determined by the water potential of both solutions, but the flow will always be into the tube because we filled the tube with pure distilled water and the outside of the tube was comprised of water and a certain solute.

The solute potential of the solution outside of the dialysis tube is determined partially by temperature, but also by the ionization constant of each substance. The substance's ionization constant is the number of particles that it breaks up into when put into a solution, so for example, glucose, a sugar that doesn't ionize in a solution, has an ionization constant of 1 because there is one particle in solution for each particle of solute added. Sodium chloride, an ionic compound that ionizes into two particles while in solution, has an ionization constant of 2. This means that in solutions with higher ionization constants, the solute potential is higher.

The question is, though, how would the group observe osmosis if it occurred at such a small scale? We weren't able to actively see the water molecules go in and out of the tubing, and there was no other way to tell if water was entering the tubing. But that is the solution as well as the problem because we weighed the tubing and its contents every 2 minutes, noting the change in weight and attributing this to the flow of water into the dialysis tube. This was how we would quantitatively measure our data.


The purpose of this experiment was to model water potential and the effects of osmosis as it would occur in a cell. We wanted to see what effects different solutes had and also wanted more practice in the lab carrying out specific procedures so that our work could be replicated if it needs be. The group hypothesized that, because sodium chloride has a larger ionization constant, the difference in solute potentials in the solution and in the dialysis tubes would cause osmosis to occur the fastest when the tubing was put into a solution of NaCl.

Procedure
The lab group started our lab by first filling a beaker with deionized, distilled water, which would be the site of our osmosis experiment. Then we obtained a length of moist dialysis tubing. We didn't want dry tubing because the membrane could dry out and affect osmosis. Next we tied a knot on one end of the tubing that we decided was the "bottom" of the length of tubing. From that point on we kept this end towards the floor so as not to spill the contents of the tubing. Then we filled the tubing with 10mL of a 1.0M glucose solution and tied off the "top" of the tube. Because the membrane was selectively permeable, no fluid dripped out of the tubing even though we were moving the tube around.

We brought the tubing back to our experimental area and weighed the tubing and its contents as our base so that we could observe the changes in weight to the tube. Next we placed the tube in distilled water beaker from the first step of the experiment and waited. From that point on, we would remove the tubing, dry off any excess water and weigh the entire system every two minutes until 15 inutes had passed.

After we finished with the glucose tube, we repeated the same procedure but substituted 10mL of 1.0M solution of sucrose and 10mL of a 1.0M solution of NaCl for the glucose solution we had used. We did this to observe the changes in osmosis that occur due to different solutes and to create more experimental groups.

Data/Results

This is the data we directly received from weighing the dialysis tubing every 2 minutes.


Mass of the Dialysis Tubing in grams
Time
Glucose
Sucrose
NaCl
0 min
11.7
12.0
11.8
2 min
12.2
12.4
12.3
4 min
12.7
12.6
12.6
6 min
13.1
12.8
13.0
8 min
13.3
13.2
13.2
10 min
13.6
13.5
13.6
12 min
13.6
13.8
13.8
15 min
13.7
14.0
13.9


The percent change was calculated using the measurements obtained from weighing the tubing. The initial weight was subtracted from the weight at each interval, then divided by that interval's weight and the whole thing multiplied by 100 to get a percentage.


Percent Change in Dialysis Tubing Mass (%)
Time
Glucose
Sucrose
NaCl
0 min
0
0
0
2 min
4.27
3.33
4.24
4 min
8.55
5.00
6.78
6 min
11.96
6.67
10.17
8 min
13.68
10.00
11.86
10 min
16.23
12.50
15.25
12 min
16.23
15.00
16.95
15 min
17.09
16.67
17.80


This is a graph of the percent change in mass of the three different experimental tubes.


Conclusion
The results of the experiment were much as the lab group had predicted. We believed that water would flow from the solution into the dialysis tubing and would be seen in an increase of the tubing's weight. This definitely happened, with the glucose tube gaining 2 grams of water, sucrose gaining 2 grams as well, and sodium chloride gaining 2.1 grams. After 15 minutes, each of the tubes had similar percent changes, but as our group had predicted correctly, the greatest percent change occurred with the tube containing the NaCl solution. Whereas sucrose only increased its mass by 16.67% and glucose only saw an increase of 17.09%, the tube with NaCl saw a mass percentage gain of 17.80%!

The experiment was quite successful in hindsight. The concept of water potentials and osmosis that we had learned in class were confirmed by the fact that all three tubes gained mass. This was due to the fact that the solute potential inside the pseudo-"cells" was lower than that outside of the "cell" because the ratio of water to solute was lower inside than outside. Therefore, water rushed in, but since the solute could not diffuse out because of the selectively permeable dialysis tube, the particles were stuck and the tubing gained mass. Our hypothesis about NaCl gaining the most percent change was correct, so the effect of the ionization constant on water and solute potential has quite an effect on osmosis. Though the sodium chloride test did gain more mass by percentage, we had expected the mass to increase quite a bit more drastically. Because the ionization constant was twice that of glucose and sucrose, we believed that the sodium chloride would have somewhere around twice the percentage mass gained, not just a measly 0.71% more than the sucrose. This could be due to experimental error of not weighing our masses correctly, or perhaps as a lab group we overstated the effects of the ionization of sodium chloride on osmosis. For a follow-up experiment, we could use solutions of higher molarity to more clearly demonstrate the effects of osmosis over the relatively short period of time that is 15 minutes. Because the solute potentials would be so much different between higher molarity solutions and pure water, osmosis would occur at a faster rate. Another possible remedy for this problem would be the short amount of time that we tested each experiment. Perhaps the NaCl system had not reached equilibrium and therefore was not as telling of its effects on osmosis than it could be. A different follow up equation would be to test the effects of temperature on osmosis. To calculate solute potential of a solution, one must factor in temperature, so temperature change must have an effect on osmosis.