Today we are going to talk about cellular respiration, a vital process that cells perform every second. Constantly, cells are breaking and forming bonds, moving molecules around, expending energy and using up substances. Why are these cells working hard all the time? Well organisms need energy to perform vital functions such as moving, reproducing and growing, and the only way to get this energy from its surroundings is to perform cellular respiration. Cellular respiration works by breaking apart a sugar and then capturing energy released from breaking those bonds onto molecules called ATP, but for now we will focus on the process of cellular respiration, not the entire process of energy transfer.Today we are going to talk about cellular respiration, a vital process that cells perform every second. Constantly, cells are breaking and forming bonds, moving molecules around, expending energy and using up substances. Why are these cells working hard all the time? Well organisms need energy to perform vital functions such as moving, reproducing and growing, and the only way to get this energy from its surroundings is to perform cellular respiration. Cellular respiration works by breaking apart a sugar and then capturing energy released from breaking those bonds onto molecules called ATP, but for now we will focus on the process of cellular respiration, not the entire process of energy transfer.
 |
| This is the chemical equation for cellular respiration |
On October 22nd, Vinay, Shreyan, Vikram, and I returned to the lab to perform an experiment to measure cellular respiration and determine the effects of sound on the respiration of a meal worm. The first problem that we encountered was how to measure the cellular respiration, a tiny chemical process, in a meal worm? The group could have measured any of the compounds formed by the chemical equation above, such as the decreasing amounts of glucose in the worm or increasing amounts of water in the worm, but these would be very difficult to measure, especially if we didn't want to kill the worms. The group instead chose to measure the increasing amounts of carbon dioxide in the air as this would show that cellular respiration was occurring. Also, the carbon dioxide sensors that Mr. Wong gave us only worked for that specific compound.
 |
| A meal worm |
After figuring out how to measure the rate of cellular respiration, the group decided how to use sound to affect a meal worm's rate of respiration. Our first thought was to use different types of music, such as a song with a slower beat versus one with a fast beat, soft sound versus loud, or a song with less bass or more bass. After some discussion, we decided to not use music because there are so many different types of sound that we wouldn't be able to track what specific difference between two songs cause a change in the worm's respiration. Instead, we decided to use extremely high and extremely low frequency sounds on the meal worms. We accomplished this by downloading a dog whistle application that had a frequency toggle on the sound it produced so that we could directly affect what our meal worms were listening to. Our hypothesis for this experiment was that the higher frequency sounds would increase the worms' rate of reaction because the energy of the sound would frenzy and eventually kill the worms.
The purpose of this lab was to design and perform our own experiment using organisms and manipulating specific factors of their environment to increase or decrease the rate of cellular respiration in the worms. The purpose is also to apply knowledge learned in class to a practical situation and see if our knowledge of cellular respiration could expand through creating our own experimentation procedures.
Procedure
First, the lab group grabbed a beaker, a Vernier carbon dioxide sensor and rubber stopper for the top. Then we put two large meal worms into the beaker and brought all of our components to our lab station. I then connected the sensor to my iPad so it would record the data of the increasing levels of carbon dioxide and graph it on my tablet. After this, we stoppered the beaker, with the sensor attached, sealing off the worms from outside air and allowing the sensor to measure the respiration. We then set the timer for ten minutes and watched our worms move around. After the ten minutes were up we unstoppered the beaker, saved our data and put the worms back into the tub of worms. We did this so that our data would not be contaminated by worms full of cells that were oxygen deprived. We wanted fresh worms for every trial.
For our second trial, we followed the same procedure as before for gathering the worms and setting up the beaker, but then played a very high frequency dog whistle sound from the iPad into the side of the beaker at the worms. We continued this for ten minutes and then stopped the sound, recycled our worms, and saved the data. The third trial was the exact same as the second, but instead of a high frequency sound, we played a low frequency sound to the worms.
Data/Results
Here is the graph of our data.
The Blue Line is our control experiment, the Yellow Line is our high frequency experiment, and the Red Line is our low frequency experiment
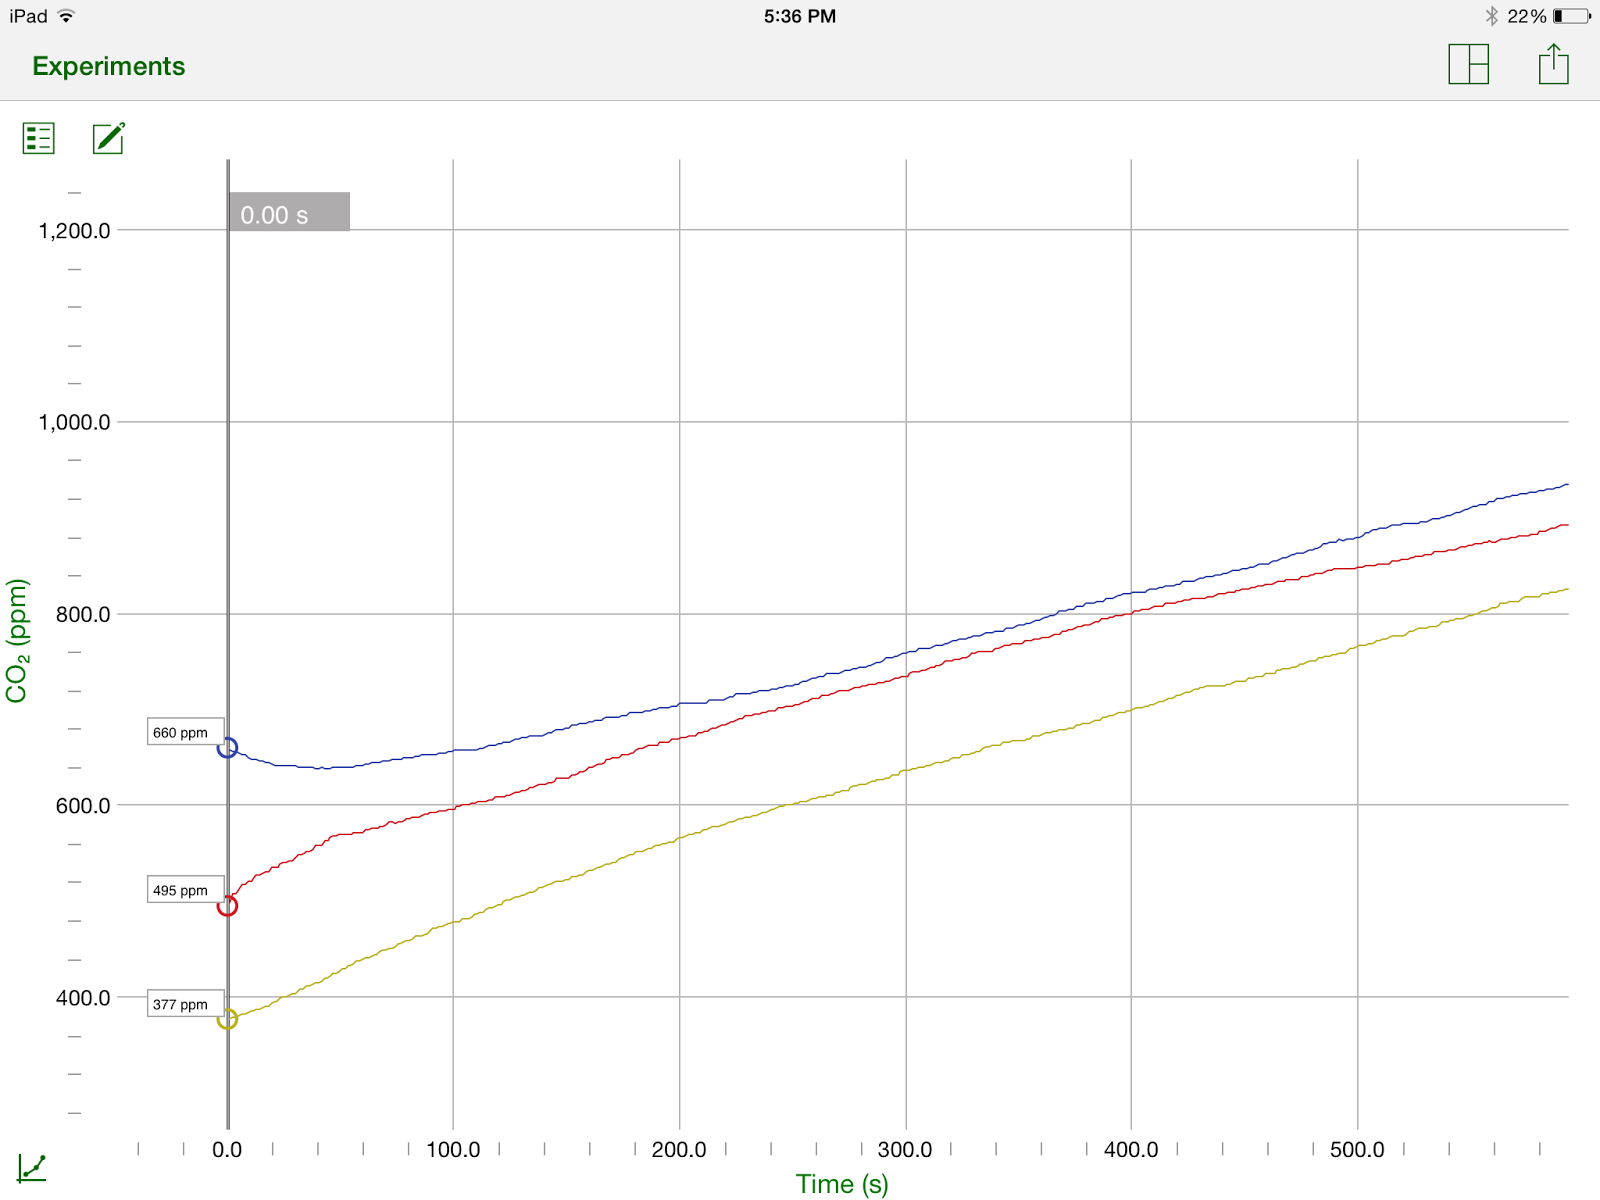
Here is a table containing all the values of carbon dioxide in the beaker every minute, and the total change in amount of carbon dioxide in the beaker. (The units are parts per million or ppm)
|
Trial/Time
|
Trial 1 (control)
(ppm)
|
Trial 2 (High
Frequency) (ppm)
|
Trial 3 (Low
Frequency) (ppm)
|
|
0 min
|
660
|
377
|
495
|
|
1 min
|
643
|
441
|
574
|
|
2 min
|
666
|
501
|
610
|
|
3 min
|
696
|
549
|
655
|
|
4 min
|
720
|
592
|
697
|
|
5 min
|
758
|
636
|
735
|
|
6 min
|
795
|
674
|
775
|
|
7 min
|
833
|
716
|
814
|
|
8 min
|
867
|
751
|
840
|
|
9 min
|
902
|
792
|
866
|
|
10 min
|
938
|
831
|
895
|
|
Total Change (ppm)
|
+278
|
+454
|
+400
|
Here are pictures of the sensor-beaker system we set up.


Conclusion
The results of the experiment were much as the lab group had predicted. We hypothesized that the worms would respire more with a high frequency sound than with a low frequency sound or the control group, which did occur. With the high frequency sound, the worms added 454ppm carbon dioxide to the air, while with low frequency they only added 400ppm and a measly 278ppm by the control group. We did not observe the worms becoming frenzied as we had though they would in the high frequency trial, and we also discovered that the worms were alive after this trial. The lab group believed that the worms would be killed by the sound, or at least use up all of their oxygen faster because of it. We may have still been right and it just takes longer for the worms to die. One oddity that we came across in our data is the relatively high rate of cellular respiration by the worms at the beginning of trials 2 and 3. For trial 2, in the first 2 minutes alone, the amount of CO2 in the air increased by about 130ppm, almost a third of the overall increase of carbon dioxide. For the third trial, the rate was somewhat less drastic, increasing by 120ppm, but still was about one third of the total change in concentration of carbon dioxide.
I believe that the experiment was quite successful in hindsight. We saw the effects of respiration on the carbon dioxide content of the beaker, and we also observed that sound has an effect on the respiration of meal worms. In both of the sound trials, the respiration of the worms greatly increased in comparison to the silent first trial. We are not sure why this occurred, but it could be for a variety of reasons. First of all, the change could have been due to the experiment's change in location for the second and third trials. So that we would not bother or disturb other lab groups and their experiments with our sound, the lab group had to move outside. Perhaps the increase in respiration was due to the sunlight, temperature, or different colored surroundings that the worms were placed in. This could be fixed by confining the worms to a certain color background and temperature exposed to steady artificial lighting to control those variables. Second of all, the increase in carbon dioxide in the beaker could be because we used different worms for each trial, but the same beaker, so there was already an abnormal amount of carbon dioxide in the beaker. When the sensor was placed in the beaker, it would have taken it a little bit to totally adjust to the true amount of CO2 in the beaker, which explains the supposedly high rate of respiration in the opening minutes of both Trial 2 and 3. This could be easily fixed by having three concurrent trials in three different beakers that had been previously exposed to similar atmospheric environments. Thirdly, the worms might have actually had a higher rate of respiration during the trials with sound because meal worms seek dark and quiet habitats in nature, such as under rocks and in caves, so the sound could be instinctively programmed into their tiny brains as dangerous. More sound would mean less isolation and therefore more vulnerability for the worm. Also, the higher pitch sound's increased effect on respiration could have been because meal worms are primarily eaten by birds, many of whom have distinctively high pitched calls. As a result, when exposed to higher pitched sounds, the worms heart rate increases and they panic to try and escape the perceived danger. I think an interesting follow up experiment would be one using specific bird calls of birds that eat meal worms. In addition, perhaps exposing the worms to pheromones from these birds, thus supplementing the illusion of an impending attack, to examine the effects of more panic on cellular respiration on meal worms.


